Statistics
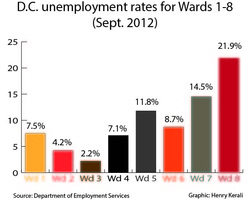
The economic differences between the wards are exemplified in statistical studies. To the right, a graph shows the current statistics for unemployment rates amongst the wards. The study, recently from September 2012, comes from the Department of Employment Services. The unemployment rate for Ward 2 is at 4.2% while the unemployment rate for Ward 7 is over 10% more at 14.5%.
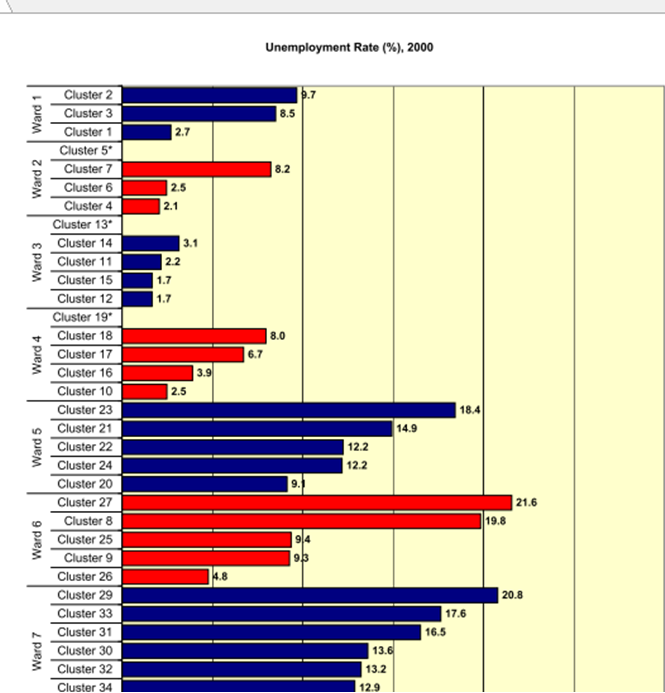
The chart below also shows the unemployment rates in the wards. However, the data, shown in The State of Washington, D.C's Neighborhoods, were gathered by NeighborhoodInfo DC in 2000. Therefore, they are not as recent but they show the unemployment rates of the wards and clusters in those wards. Georgetown, which is a part of cluster 4 in Ward 2, had only a 2.1% unemployment rate. The lowest unemployment rate in Ward 7 was 12.9 while the highest stood at a staggering 20.8%.
The chart below also shows the unemployment rates in the wards. However, the data, shown in The State of Washington, D.C's Neighborhoods, were gathered by NeighborhoodInfo DC in 2000. Therefore, they are not as recent but they show the unemployment rates of the wards and clusters in those wards. Georgetown, which is a part of cluster 4 in Ward 2, had only a 2.1% unemployment rate. The lowest unemployment rate in Ward 7 was 12.9 while the highest stood at a staggering 20.8%.